
TruckStock’s reports show what your trucks have requested and what they have on hand. This guide covers the two reports available today, Items Requested and Available Stock. Reports will grow over time, and we’ll update this guide as new ones are added.
Before you start
- Who can do this: company admins, since reports are on the Administration page.
- What you need: some requests and stocked trucks, so the reports have data to show.
Open the reports
1. Find Reports on the Administration page
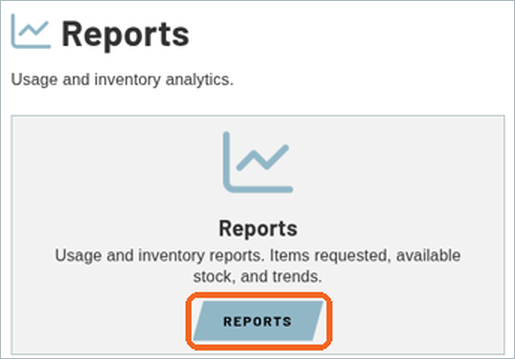
Click Administration and scroll to the Reports section, described as Usage and inventory analytics. Click REPORTS.
2. Pick a report
The Reports page has two reports: Items Requested and Available Stock.

Items Requested report
3. Set the dates
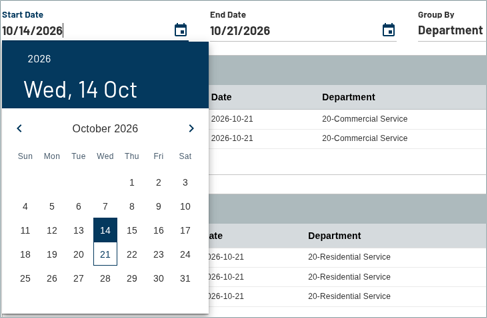
Click ITEMS REQUESTED. The Start Date and End Date start out covering the past week, up to today. Type a date, or click the calendar icon to pick one.
4. Choose how to group the results
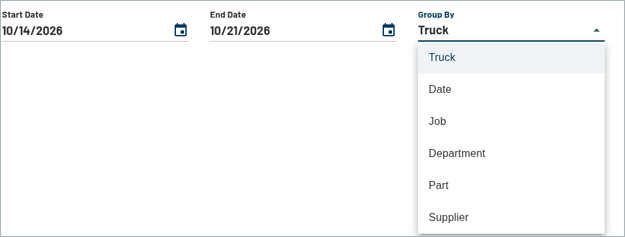
Open Group By and pick Truck, Date, Job, Department, Part or Supplier. Truck is selected to start.
5. Create the report
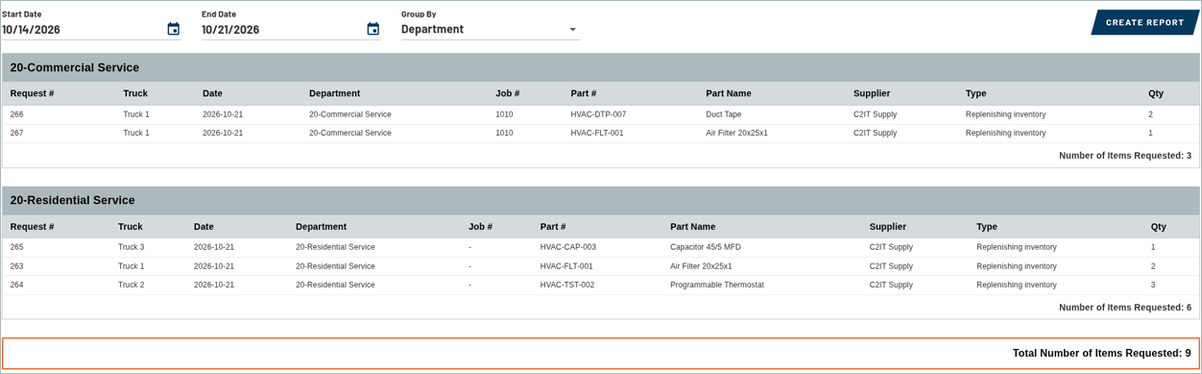
Click CREATE REPORT. The results appear in a section for each group, with these columns: Request #, Truck, Date, Department, Job #, Part #, Part Name, Supplier, Type and Qty. Each group ends with its Number of Items Requested, and the Total Number of Items Requested is at the bottom.
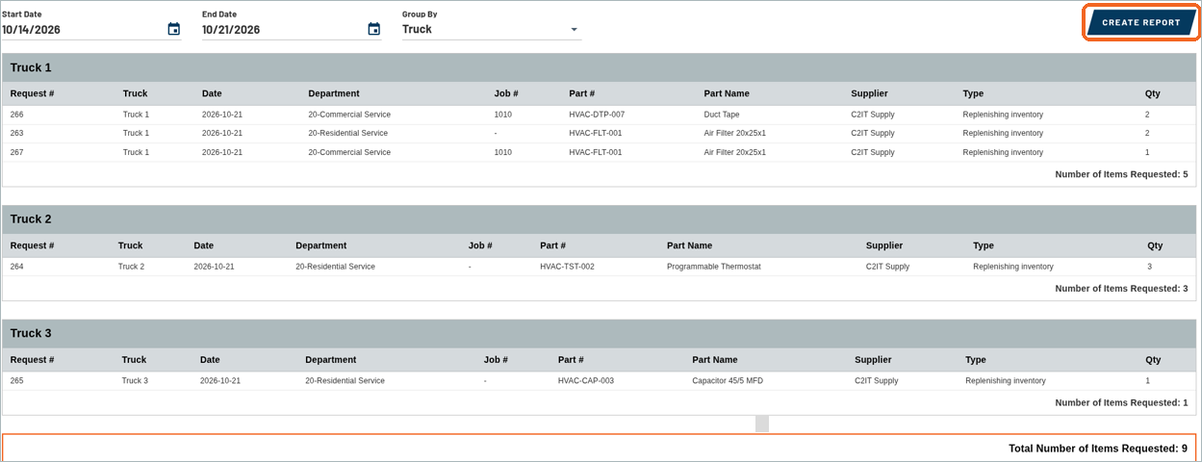
6. Change the grouping
If you pick a different Group By option, click CREATE REPORT again. The results don’t change until you do.
7. Download the report
Once you’ve created a report, click DOWNLOAD EXCEL FILE OF REPORT at the bottom right to download it as an Excel file.

Available Stock report
8. Choose a truck
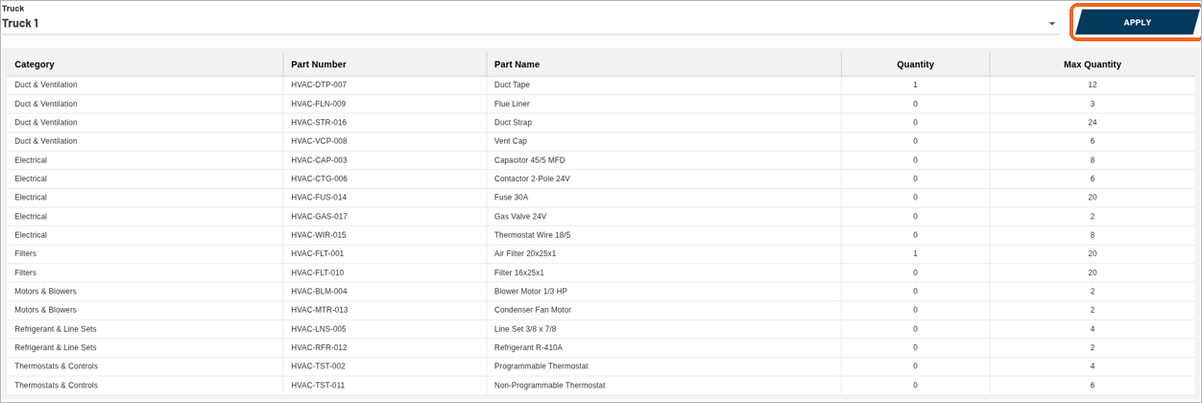
Go back to Reports and click AVAILABLE STOCK. Pick a truck from the Truck list. APPLY becomes available once a truck is chosen.

9. Apply and read the results
Click APPLY. The report lists the truck’s parts with their Category, Part Number, Part Name, Quantity and Max Quantity. You can download it with DOWNLOAD EXCEL FILE OF REPORT, the same as the Items Requested report.
Recent Comments